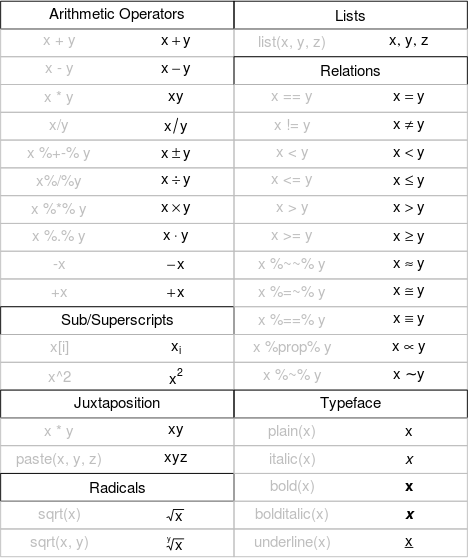
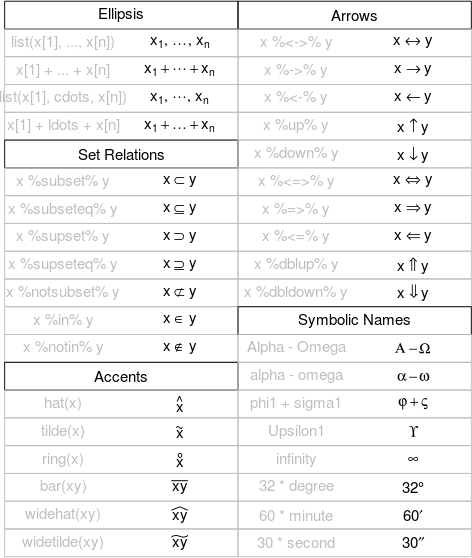
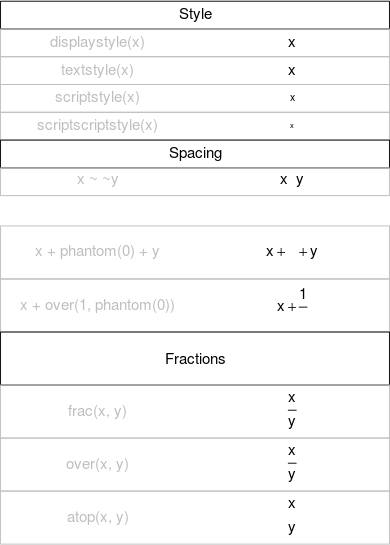
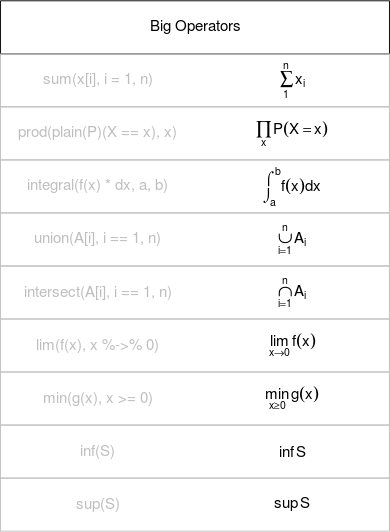
Mathematical Annotation in R
Want to write mathematical symbols and expressions in R graphics? You can use an R expression()
instead of normal text, e.g. plot(1:10, main = expression(alpha + beta)). Below is a demo that
shows you everything about plotting math in R (it was written by the R Core Team; see ?plotmath
for details):
demo(plotmath)
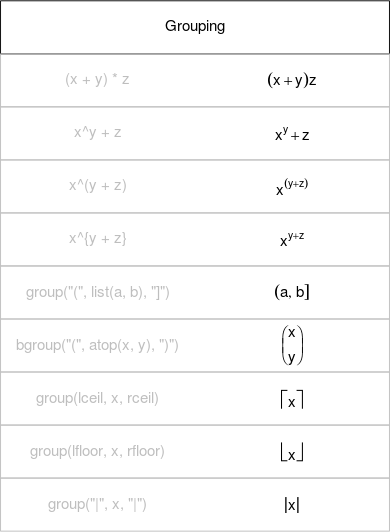
Combining expressions and text
If you want to combine multiple mathematical expressions with text, use paste() inside
expression(), as in the following.
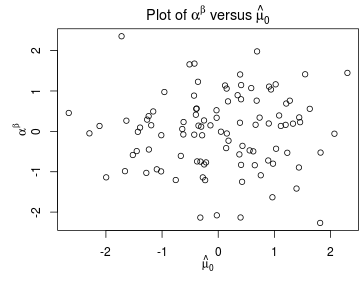
par(mar = c(4, 4, 2, 0.1))
plot(rnorm(100), rnorm(100),
  xlab = expression(hat(mu)[0]), ylab = expression(alpha^beta),
  main = expression(paste("Plot of ", alpha^beta, " versus ", hat(mu)[0])))
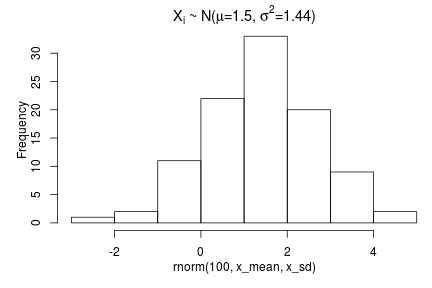
Finally, if we want to include variables from an R session in mathematical expressions, and
substitute in their actual values, we can use substitute().
par(mar = c(4, 4, 2, 0.1))
x_mean <- 1.5
x_sd <- 1.2
hist(rnorm(100, x_mean, x_sd),
  main = substitute(
    paste(X[i], " ~ N(", mu, "=", m, ", ", sigma^2, "=", s2, ")"),
    list(m = x_mean, s2 = x_sd^2)
  )
)
References
- This article was reproduced from vistat
Published
08 April 2013