Contour Plots with D3 and R
D3 is a popular JavaScript library to draw graphics on the web. Powerful as it is, it also has its challenges, especially for people usually working e.g. with R – in which plots can be drawn without thinking of primitives such as points, lines, segments and so on, and all kinds of statistical functions are there to be called. In this article I explain how to combine R and D3 to draw a contour plot.
Computing in R

The computation of contour lines can be challenging to JavaScript but is extremely easy with R
using the contourLines() function, so we pre-process the data and make it ready to JavaScript. We
make use of the good old volcano dataset here and draw a contour plot to visualize the altitude
corresponding to a grid of latitudes and longitudes (the picture above of the volcano is from
Wikipedia).
res = contourLines(volcano)
str(res[1:2])  # first two elements of the list
## List of 2
##  $ :List of 3
##   ..$ level: num 100
##   ..$ x    : num [1:47] 1 0.988 0.978 0.977 0.965 ...
##   ..$ y    : num [1:47] 0.552 0.552 0.567 0.568 0.568 ...
##  $ :List of 3
##   ..$ level: num 100
##   ..$ x    : num [1:16] 0.908 0.919 0.93 0.942 0.943 ...
##   ..$ y    : num [1:16] 0 0.0151 0.0151 0.0151 0.0167 ...
We can see the results returned by contourLines() is a list of sub-lists: each sub-list contains
the x-y coordinates of polylines. Now we convert this list to a JSON array of the form:
[
{
  "x": [0, 0, 0, ...],
  "y": [0, 0, 0, ...]
},
{
  "x": [0, 0, 0, ...],
  "y": [0, 0, 0, ...]
},
...
]
And write the data to a script tag:
xy = paste(unlist(lapply(res, function(z) {
  xs = paste(round(z$x, 3), collapse = ",")
  ys = paste(round(z$y, 3), collapse = ",")
  sprintf("{\n  \"x\": [%s],\n  \"y\": [%s]\n}", xs, ys)
})), collapse = ", \n")
cat("<script>", sprintf("var data = [%s]", xy), "</script>", sep = "\n")
Draw lines in D3
Now we are ready to call D3 to draw all the lines (see the HTML source code of this page):
This is indeed a plot drawn by D3; if you do not believe it, mouse over the lines and you will see them highlighted in yellow, or refresh this page to see line width transition from 0 to 2.
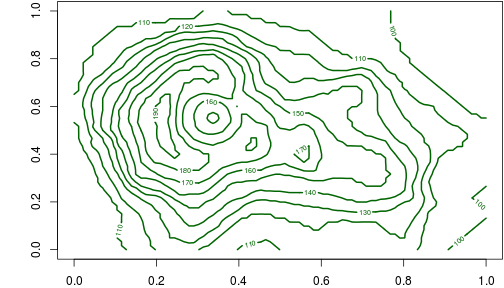
With R, it is just one line of code but it is a static plot (not interactive):
contour(volcano, col = "darkgreen", lwd = 2)
Conclusion
It is rare that we solve a problem with a single tool. Take the advantages of all tools instead of
blindly believing that one ring will rule them all. R is good for statistical computing and
graphics, and D3 is awesome for the web. Both are good in one way but weak in another, so let’s
make 1 + 1 > 2.
References
This article was reproduced from vistat.